Promotion Analysis
Catherine Williams et al.
May 3, 2019
Class Group Project
Project Description
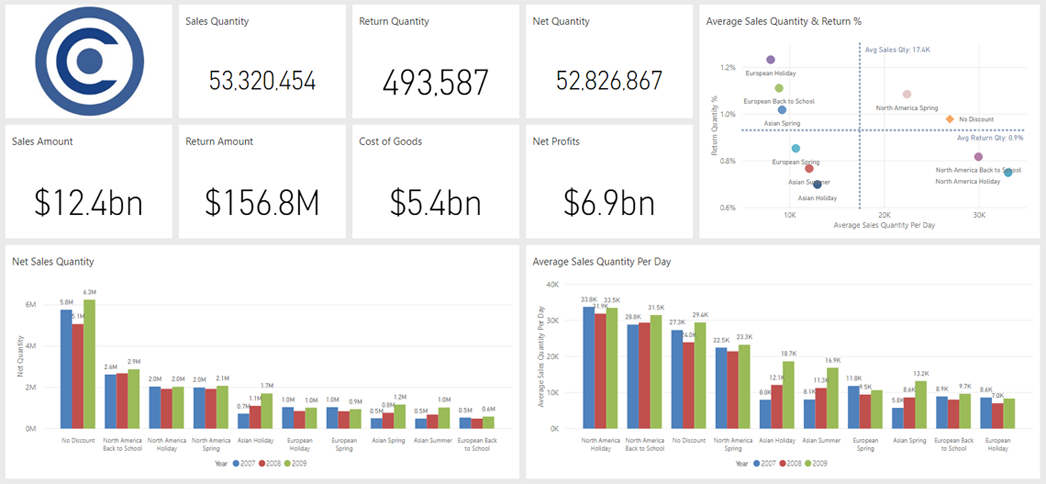
Build a report that analyzes the success of promotions. The client would like to measure the "success" of the promotion using two metrics, the Average Sales Quantity Per Day during the promotion, and the Product Quantity Return Ratio.
The client would like two pages in the report, one page for the promotion analysis, and one page to see the product detail breakouts, for any given promotion.
Once you've created a completed report, the next step is to publish the report so the client can view the report, and consume its content online. To demonstrate you're able to publish a completed report, create a dashboard.
Dataset
Data contains sales information for a fictitious company, Contoso Inc.
Dashboard